The statistical analyses presented here are using ARRL Contest Branch data published to Members section of the website annually, for Field Day 2005-2013. Computations by N1VUX done mostly in R for statistics, with Perl for ingest and some spreadsheet.
This is a statistical adjunct to the Treemap charts analysis of the same data, which graphically uses the area of each box is proportional to the reported score, sliced by Section/Division, Class/Category.
Disclaimer - since the data only include clubs and individuals who submitted scores to Contest Branch, some significant number of clubs and individual operators who enjoy operating in the field but don't do contest paperwork are omitted.
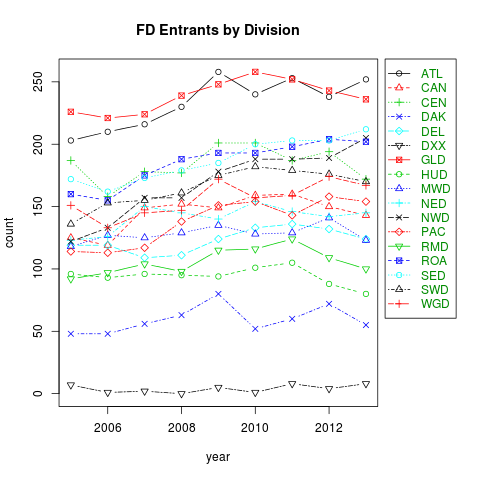
Field Day entrants per division have been generally improving, although 2013 was down from 2012 nearly across the board. Our own NEDiv was one of the few showing an Uptick in 2013
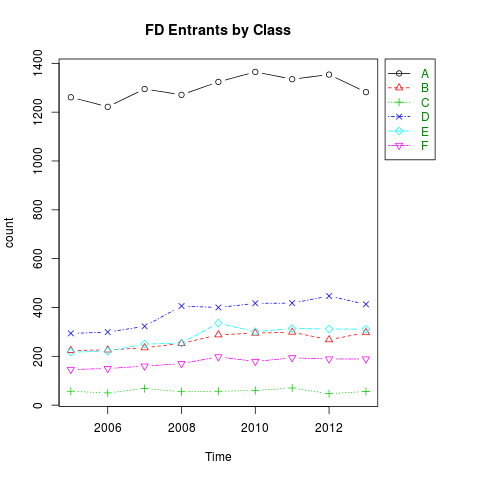
Entrants by Class are generally trending up very slowly, all classes, with only F and D participating in the 2013 downtick.
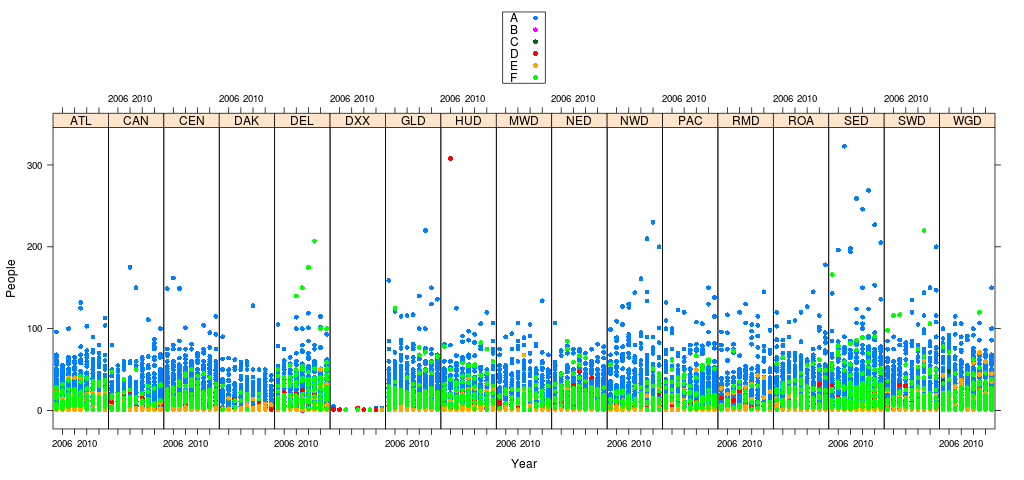
Each score submission includes a Number of Participants, which typically includes Operators, campers assisting otherwise, family, and visitors in guest logbook. We can see that in most Divisions the Club Class A Public stations range larger than Class F Emergency Management stations, while all other classes are quite small. However, Dakotas have only smaller F's, and Delta has F's as large or larger than A's. (DX stations quite reasonably are small operations.)
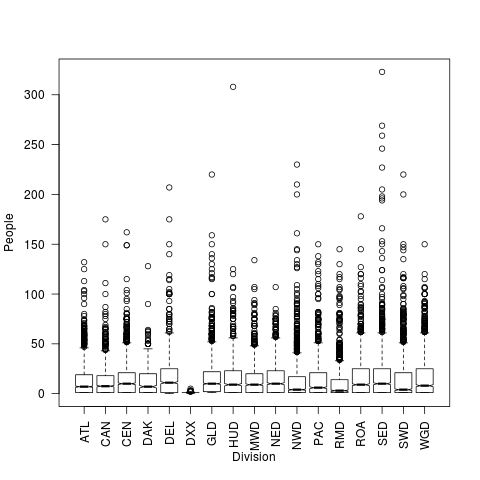
However, the prior graph is so congested its hard to see density in the low range. In this Box-plot, notice that 3/4 of all stations reporting (top of box level is 3rd Quartile) have fewer than 2 dozen people. The outliers with 50-300+ attendees+operators are rare, in all Divisions.
The biggest decision for planners is Class and Category and Power Level. The Category comprises a number of transmitters (not including certain "free" exceptions), and a Class letter (with optional trailing letter/number). Class A is Club/group Portable on emergency power; B is small portable (1 or 2 people for second digit, possibly battery for second B); C is Car etc, D is home station, E is home on emergency power, F is fixed emergency management station (with emergency power available). Low power (QRP) ≤ 5 Watts and not on motor-generator for all contacts. Mid power ≤ 150 Watts for all contacts (motor-generator allowed). High power (QRO)if any contacts > 150 Watts (upto max legal 1,500W).
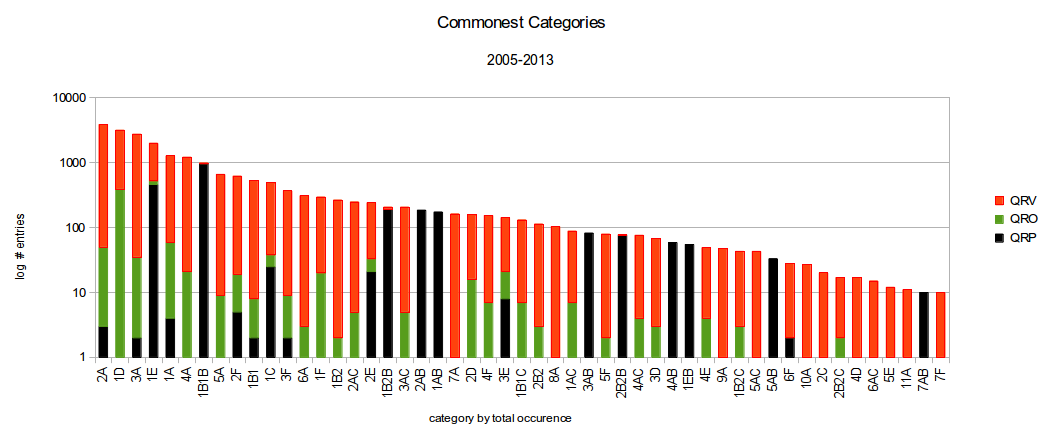
Actual usage tends to cluster.
Most entries are
2A or 3A on medium power,
1D medium (or QRO 1 in 8),
1E medium (or QRP 1 in 20).
The commonest QRP are 1B1B&1B2B (1-2 people Battery), 1E, 1AB,2AB,3AB (Battery), and 2B2B (2 Transmiters 2 People Battery).
The commonest QRO are 2A, 1D, 3A, 1A, 4A, 5A, 2F, 1B1 (not battery!).
Note: Y axis is Logarithmic, so small numbers are visible at the bottom. Bars are thus NOT proportional.
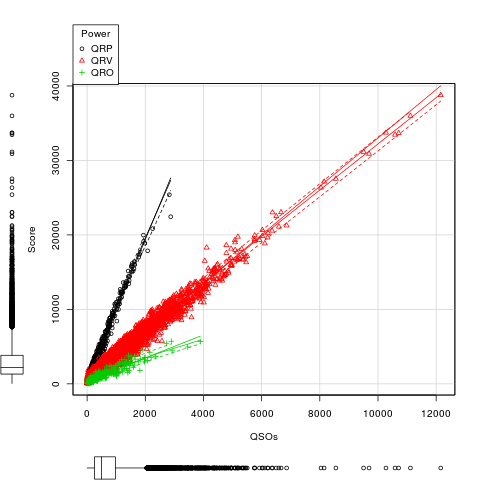
Aside from Bonuses, the Score is Contacts multiplied Power Multiplier (with Data contacts counting double, including Morse "Original Digital"). Low power called QRP is 5x, medium power (called here QRV which means active on air )is 2x, high power called QRO is 1x. So each contact may be worth 1, 2, 5, or 10 points. The QRP stations may have to "hunt and pounce" while others may be able to "work a pileup" - that's what QRO intend to do.
One can see QRP stations work mostly 2pt Data/CW to average 10pts/QSO from the slope of the black points' trend line.
The slope of the Red trend line is 3.3pts per, so average power stations tend to do about 2 CW for every 1 Phone contact. 4+4+2=3.3 * 3 At lower totals, some stations specialize in CW (high side of red bulge), others in Phone (SSB & FM, low side of red bulge).
Interestingly the green QRO high power not getting a lot of total QSOs, although we theorize they'll have beneficial workrate (which we'll see below). They are averaging close to about 1-5-2pts per so are somewhere between one Phone for one CW to all CW.
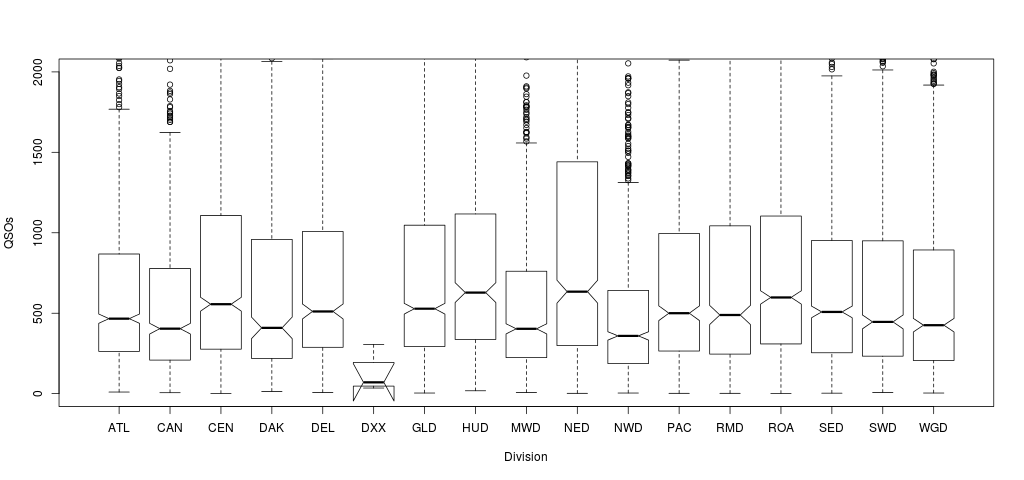
Theory (carried over from Sweepstakes) is that central sections should have an advantage, due to having more neighbors. Do corner Divisions have fewer total contacts than cental ones in FD? Not in the portion of the sunspot cycle this data views; the higher population density of coasts must make up for lack of neighbors to the sea-ward. (The DX stations do NOT.)
It's NorthEast Division has the exceptional number of Contacts, or QSOs. We'll dig into that further.
(Sweepstakes uses number of Sections worked once as multiplier, so being central is an advantage.)
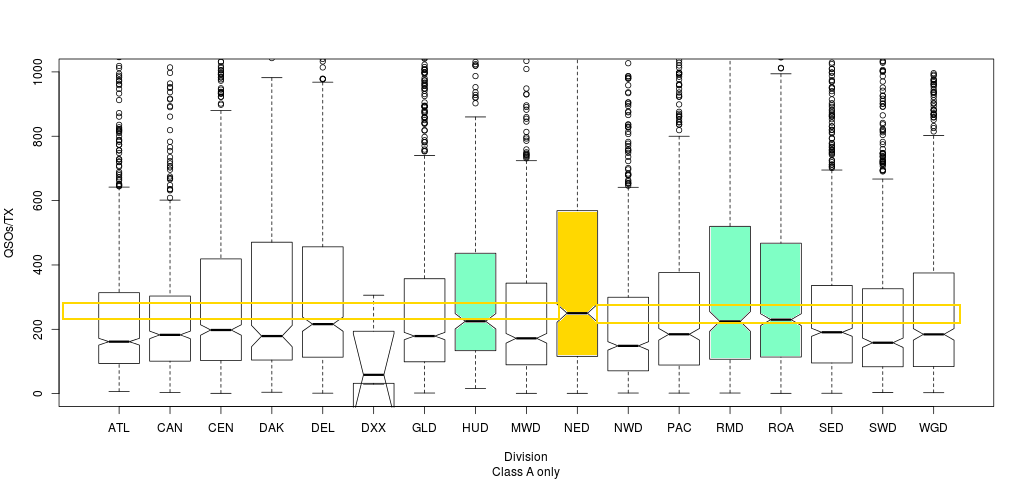
Taking the number of Contacts per declared Transmitter in category, QSOs/TX, the NED still outstanding, with only three divisions' medians falling within the confidence-range "notch" around NED median.
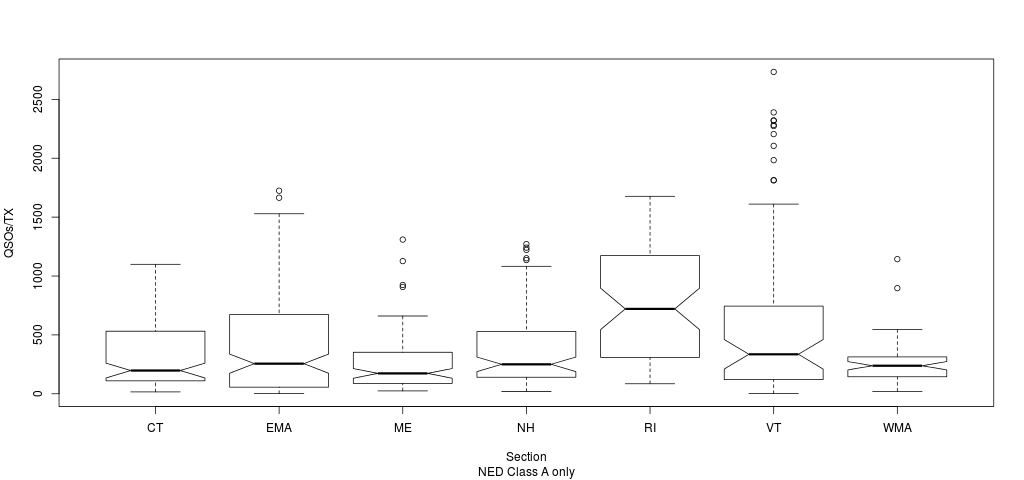
It seems the excess QSOs in NEDiv all come from an extraordinary rate of QSO per Transmitter in Rhode Island plus the top quartile in EMA and VT, and rare outliers in the other NEDiv Sections. Congratulations, Rhode Island.
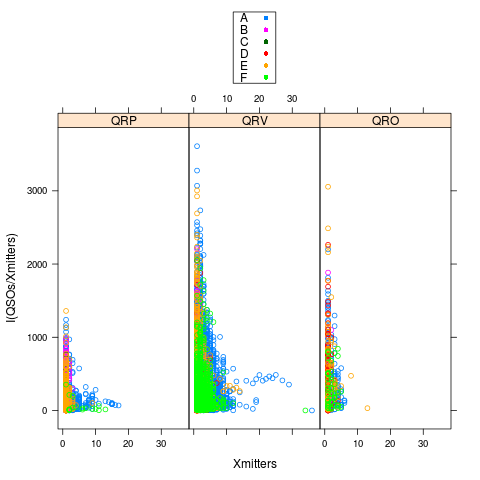
Returning to Class, Category, Power relationships. We can see the QSO/TX typical in small stations does not carry over when more transmitters are added. This makes sense as in prior years (but no longer), extra phantom "transmitters" were charged if a single multiband radio was band-hopping and/or mode-hopping quickly, so two or more "transmitters" were limited to a single operator's QSO rate.
Retirement of that rule should make it harder to get large TX Class count (done variously to maximize the 20 TX *100 pts Emergency Power bonus, or just to be flamboyant, or pick a rare class Win the Class, or all of the above). Now you need as many simultaneous transmissions (not counting free stations ) as claimed, and all must have a properly qualified Control Operator within reach on the log too. So far they haven't asked for proof of what time you had all those signals on ...
So unless you have or can assemble a massive DC to Daylight contest station capable of simultaneous Data, CW, and Phone on every ham band (except WARC and 60m which, like 146.520, are off limits! ) and the operators to run them, you don't need a huge TX count in the category. (Sometimes forgotten is the on a Band, FM SSB and AM all count as single Phone mode for Field Day -- mostly an issue 10m, VHF, UHF.) But Digital Data (PSK, packet, whatever) and CW (even if computer keyed!) are separate modes. (Unclear what the new Digital Voice modes count as, other than Demo bonus.)
Max Bonus at 20A fits with 2 stations (for 2 modes) on all ham bands 160m - 440 (70cm) Adding a third station capable of Digital on each band would be 30. Adding the 900MHz, 1.2G, 3G, 5G, 10G bands, and 45A is in theory possible, (and even higher with more exotic microwaves), but those are populated for simplex only on microwave hilltop contest weekend, you'll only get 1.2G simplex by moving a nearby FD site up. If 1.2G is in a multiband rig with 440, no extra charge for the Moving Up now. (Is modulated light still a band? i don't see it.)
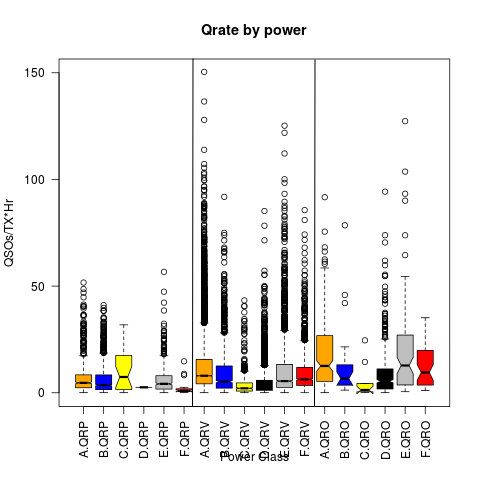
If we assume each Transmitter is on for the full 24 hours (ignoring possible bonus hours for quick setup and also still ignoring the "free" VHF, GOTA, Satellite transmitters ), what QSO rates are typically averaged? (Average rate, so Maximum and sustained rates will have to be (have been) higher!) Here we have low power QRP to the left, normal stations central, and high power (QRO) to the right; subdivided by station class.
As expected, high power is efficient, it works more per hour by running the pile-up, if adequately staffed; and QRP low power must seek out stations that can hear them, possibly by waiting until last in the pile-up.
The surprise is the highly variable average work rate for QRP Class C Car stations; there likely are just a few specialized mobile contesters skewing this one (as suggested by wide notch yet no outliers).
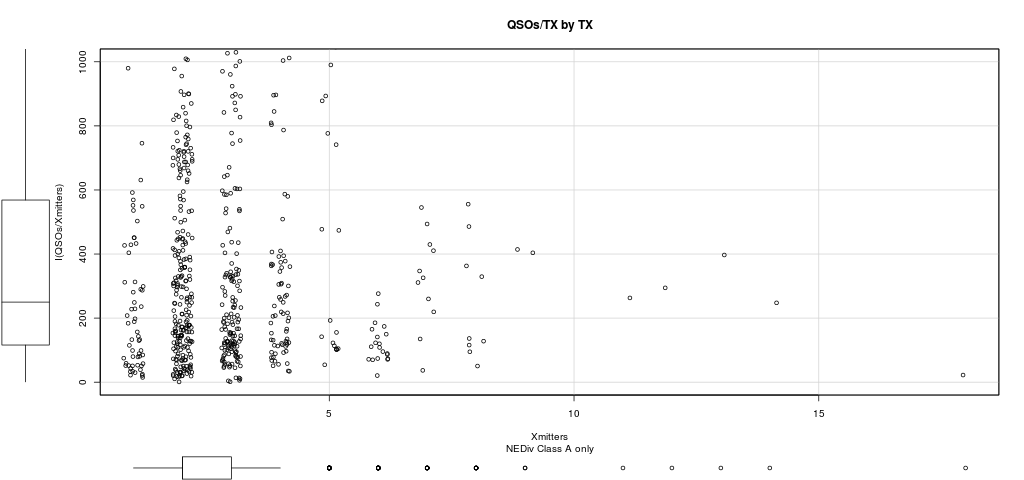
This again total QSOs per TX (not hour rate), restricted to just New England Division, Class A stations, with the outliers clipped past 1000q/TX. We note that going beyond 4A the average Q rate per fell off. This can be ok if there are periods of heavy use but not efficient.
Focussing on the local Eastern Mass Section (EMA) that sponsors this website ...
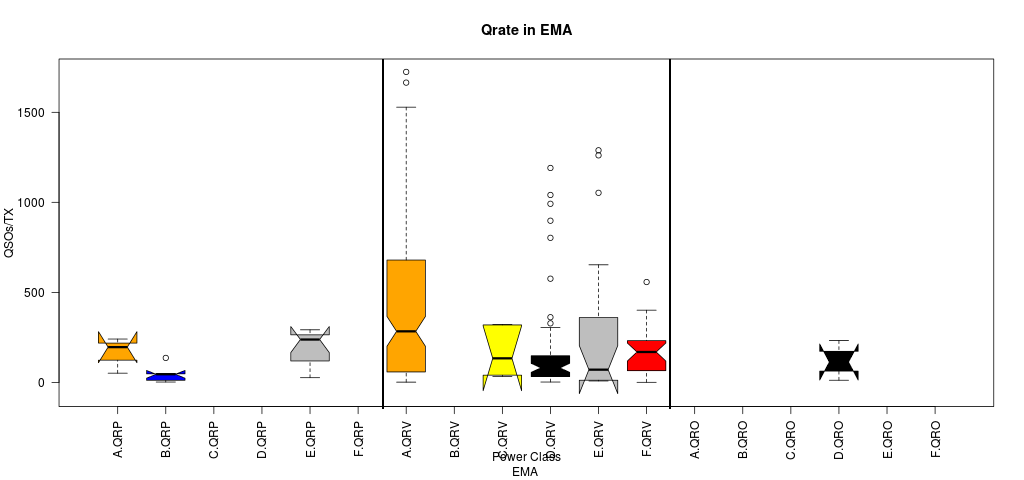
We see there were no QRO Class A stations 2005-2013, only Class D QRO, and little QRP, in A, B, or E.
We see wide variation in QSOs per TX achieved in the A stations. Some stations staff more fully. (And as noted band switching had "phantom" charge in years past.) The lower variability with lower average rate in C,D,E,F stations is likely due to reduced operating hours (no overnight shift), not to lower peak workrate.
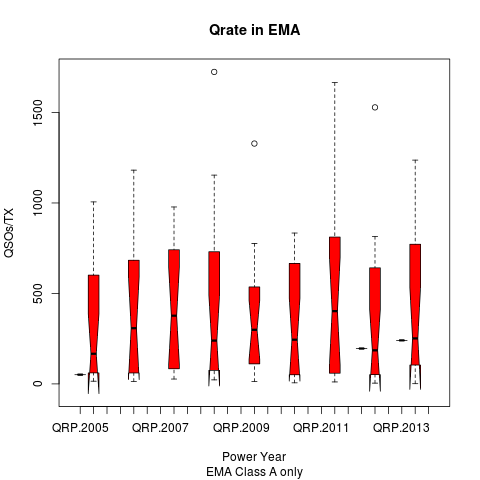
Filtering on Class A, EMA only, over the span of years, we see that comparison of the confidence intervals around the medians in inconclusive for ≤150W stations, so no trend found.
For deeper analysis of EMA history, see the history table; for EMA, NED, or nationwide by Class Category and Callsign, see TreeMap Analysis.
Pages in FD web: EMA FD Home!
§ Directory!
§
Site List
§
Tour Plans
§ FD and ICS/NIMS !
§ FD Planning,Rules, Scoring, & ARES
§ Safety:
Safety Officer, Lightning, Heat, Resources!
§ EMA FD History 1999-2023
§
About (Notes, Credits)
Up: EMA Home §
EMA ARES
Copyright © Eastern Massachusetts ARRL 2006-2014. Responsibility for content of all posted material above
rests exclusively with the site authors. ARRL staff assumes no responsibility for errors, omissions, and accuracy
of items appearing on this page. All questions and comments should be directed to the item author.